CO2 Monitor
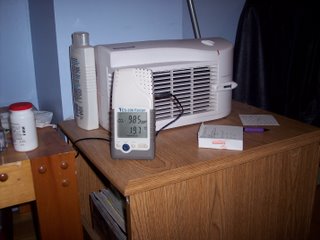 From Friday, October 13th until Monday, October 16th I had a CO2 monitor in my room for the purposes of monitoring indoor air quality for a lab for my air pollution class, ENVE 4003.
This is a picture of the monitor one of those days when my door was open. It is really simple looking but really cool. It logged the CO2 concentration in ppm (parts per million), the relative humidity in % and the temperature in degrees 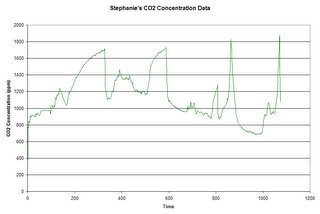 Celcius. The reading in the picture means that in one cubic centimetre of air there are 985 parts of CO2. It sounds worse then it is really. It is also saying that my room was 19.7 degrees but it felt much colder. The temperature got as low as 16.7 in my room the one night, brr. Anywho, I got the results from the time period in which I had the monitor and it looks really cool so I decided to share it with everyone.
 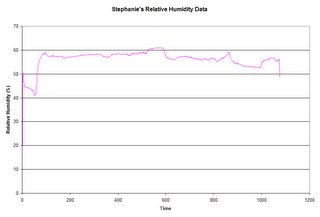 The first graph is the CO2 concentration, the second is the Relative Humidity and the third is the temperature. The CO2 is the most interesting. It goes up when my door is closed, when the fan is on, when there is more than one person in the room or when there is large amounts of activity in the room and it goes down when there is no one in the room, when the door is open, when the window is
 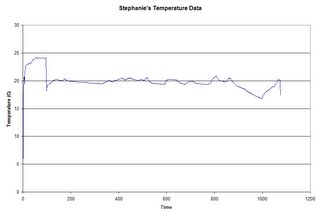 open, etc. You'll have to ignore the x-axis for now, I am still working on getting that to display the right thing. This is just how excel wanted to do it, now I have to go tell it how to do it correctly.



1 comments:
ok I like that you shared...but...I don't get it...you will have to explain it too me. hehe I like all the pictures and pretty graphs though
Post a Comment